
Runs have collapsed faster than offensive traffic.
The early Division Series is not best summarized as “offenses disappeared.” Hits plus walks fell only 8.9% per team-game from the Wild Card round, while runs fell 42.0%. The larger change is what happens after a club reaches base: fewer productive sequences, fewer damaging home runs, and far less room for a missed conversion.
Wild Card round versus first two Division Series dates
All nine completed Wild Card games compared with the first six completed Division Series games.
| Measure | Wild Card | Division Series | Change |
|---|---|---|---|
| Runs per team-game | 4.17 | 2.42 | −42.0% |
| Hits + walks per team-game | 10.33 | 9.42 | −8.9% |
| Runs per hit + walk | 0.403 | 0.257 | −36.2% |
| Starter ERA | 3.36 | 1.90 | −43.4% |
| Bullpen ERA | 4.71 | 2.56 | −45.5% |
Starters averaged virtually the same innings per start—4.33 in the Division Series versus 4.32 in the Wild Card round. The shift is efficiency, not simply starter length: Division Series starter ERA fell to 1.90 and bullpen ERA to 2.56.
Five of six Division Series games have been decided by two runs or fewer, and four winners scored three or fewer. In that environment, a walk, advance, or timely hit can matter more than a lineup’s aggregate game total.
The matchups are telling different stories.
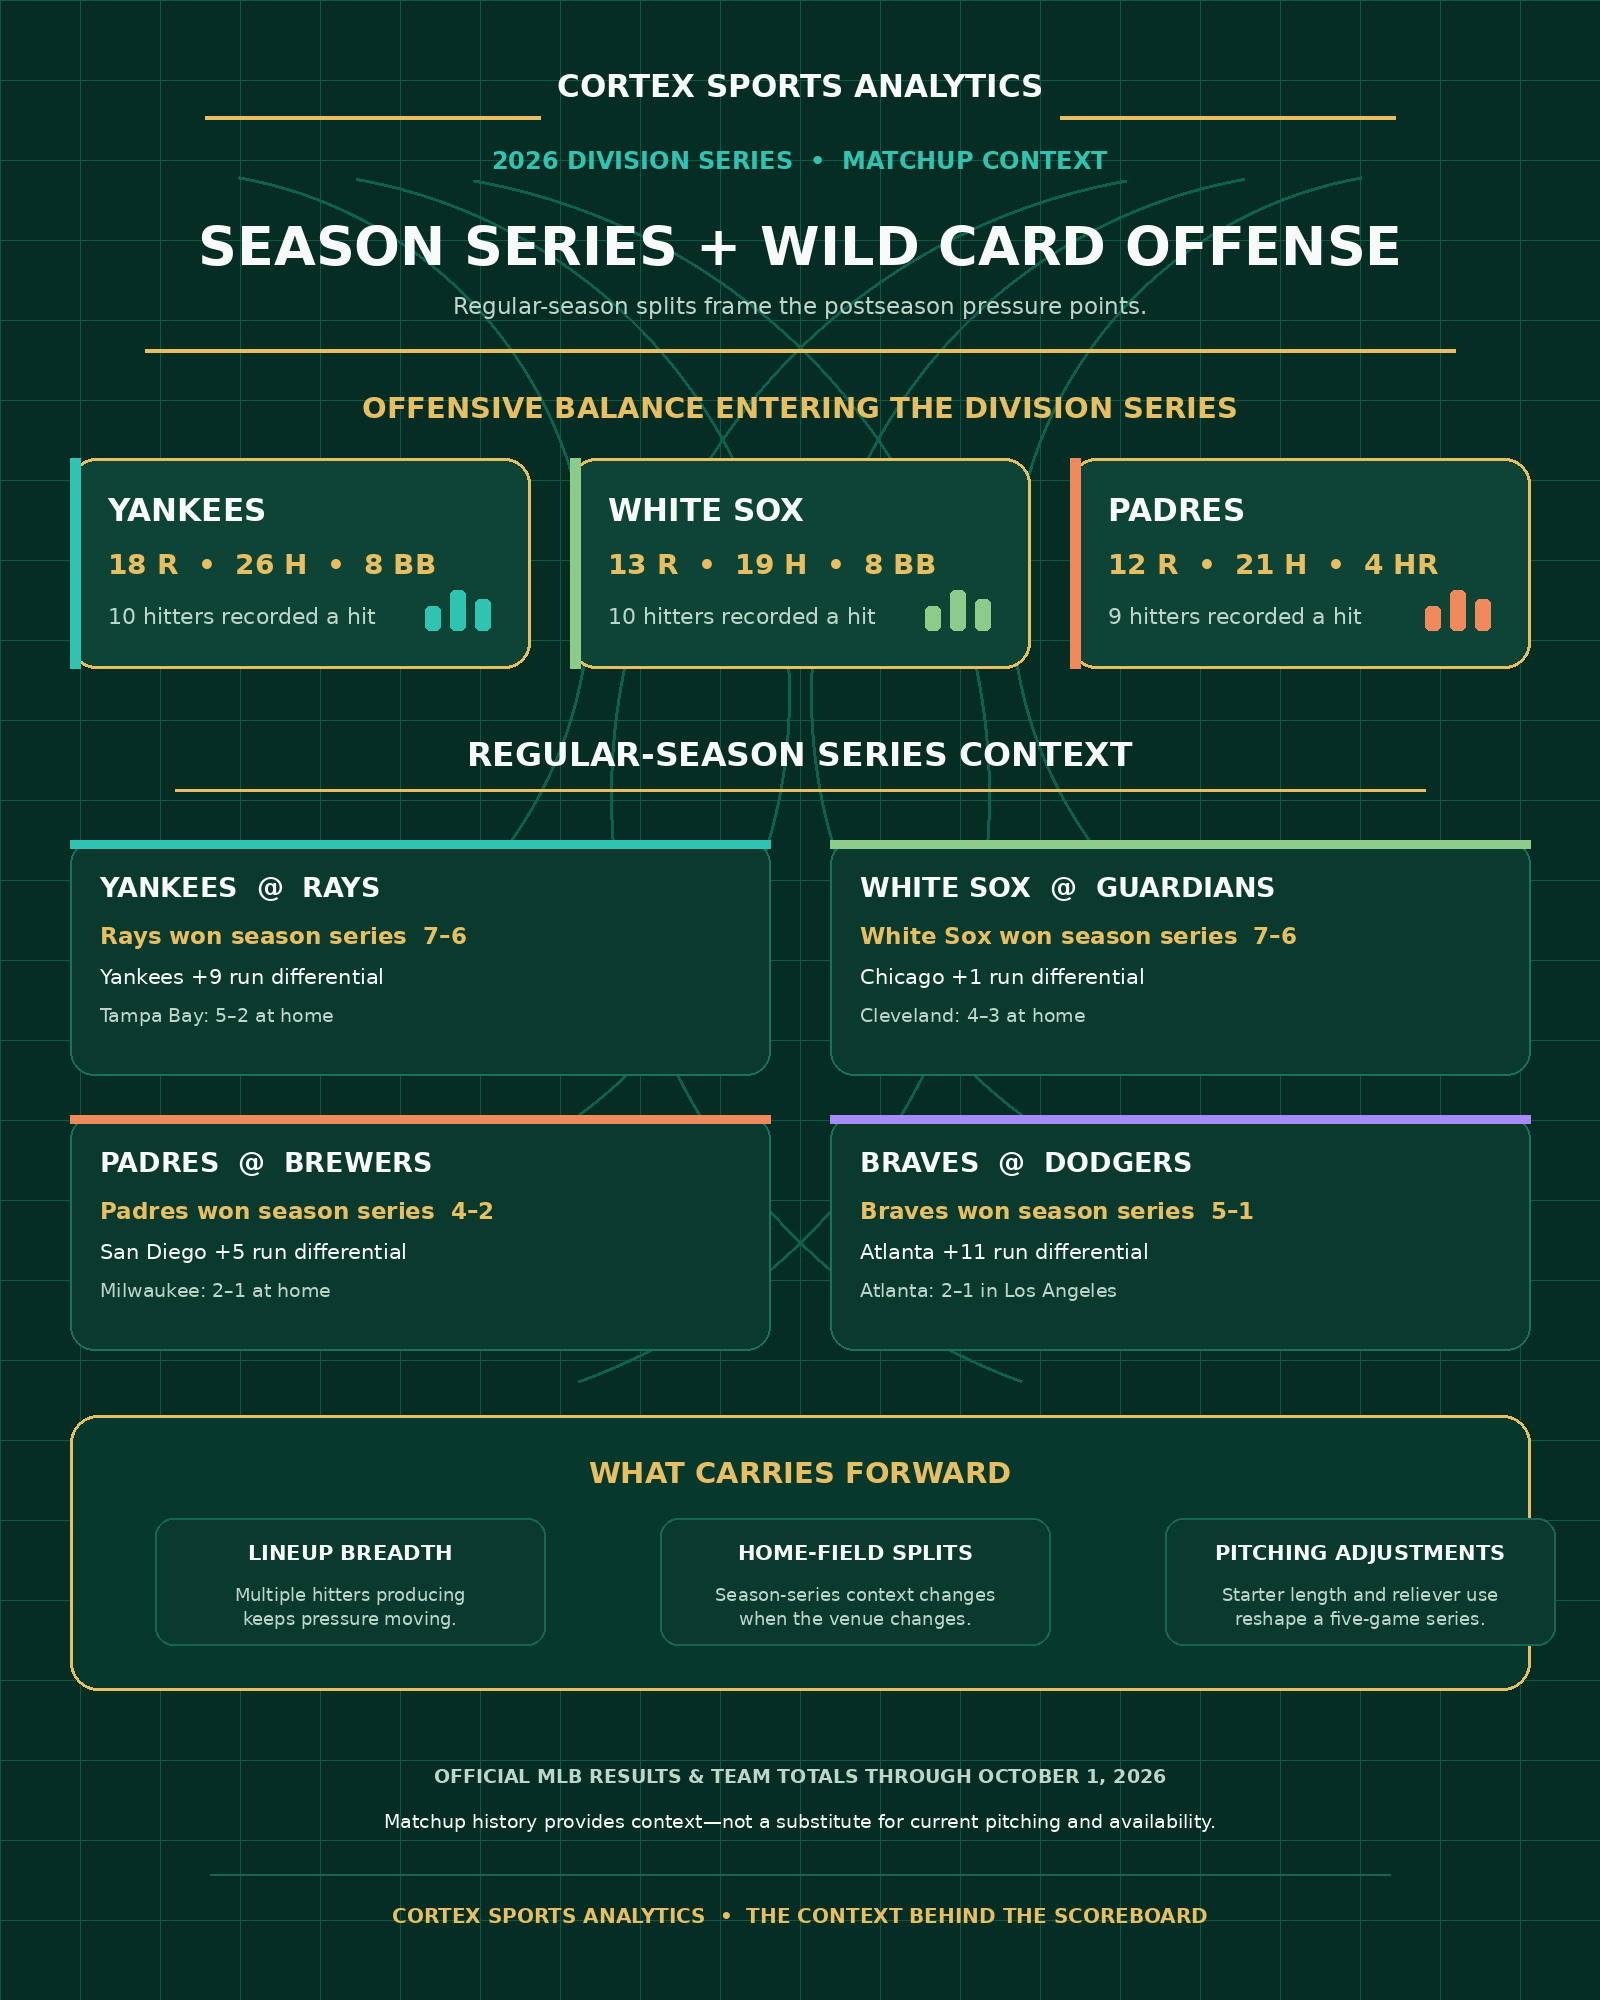
A regular-season series record is valuable only when it is paired with venue, pitching configuration, and the way each club is actually creating runs. The four series do not point to one universal explanation.
Padres at Brewers
San Diego created more basic traffic through two games—14 hits and 9 walks—but Milwaukee turned its 12 hits and 8 walks into seven runs to San Diego’s five. That mirrors the regular-season split: Milwaukee was 2–1 at home, while San Diego was 3–0 at Petco Park.
Yankees at Rays
New York carried a 54–45 overall regular-season run edge in the series, but Tampa Bay was 5–2 at home. The opener showed why venue context is not a footnote: Drew Rasmussen’s eight scoreless innings converted that local advantage into a 1–0 win.
White Sox at Guardians
The 7–6 regular-season series was nearly even in both wins and runs. In Game 1, Cleveland drew five walks but scored zero times. The next signal is whether it can turn early traffic into runs before Chicago’s relief layer is engaged.
Braves at Dodgers
Atlanta’s 5–1 regular-season edge is context, not a conclusion. Los Angeles opened with power and Tarik Skubal’s containment; Atlanta answered in Game 2 with eight walks, no home runs, and a 3–2 win—an adjustment in offensive path rather than a simple hot-or-cold verdict.
Traffic-to-run conversion, handoff quality, venue, and offensive path.
The next meaningful signals are whether San Diego converts traffic at Petco Park, whether New York can create a path through Tampa Bay’s home-field pitching profile, whether Cleveland turns walks into early runs, and whether Atlanta can sustain its Game 2 discipline adjustment.
Method and limits
Cortex compared all nine completed 2026 Wild Card games with the first six completed 2026 Division Series games, plus 2026 regular-season team data and direct regular-season head-to-head records through September 28. Results are descriptive context, not a permanent re-rating of teams or a guarantee of future outcomes. Analysis is for informational and educational purposes.
Official MLB Stats API source